Organisation tips
Breathe New Life into Conversational Dashboards

Aaron Cunnington
With 17+ years of Australian and international experience, Aaron is a seasoned digital executive, leader, and strategist. Known for his positive attitude, generosity, and sense of humour.
June 22nd, 2016
Conversational user interfaces are breathing new life into dashboards. To steer you through the process it’s important to consider some fundamental questions.
1. What’s important? Identifying key metrics for your organisation.
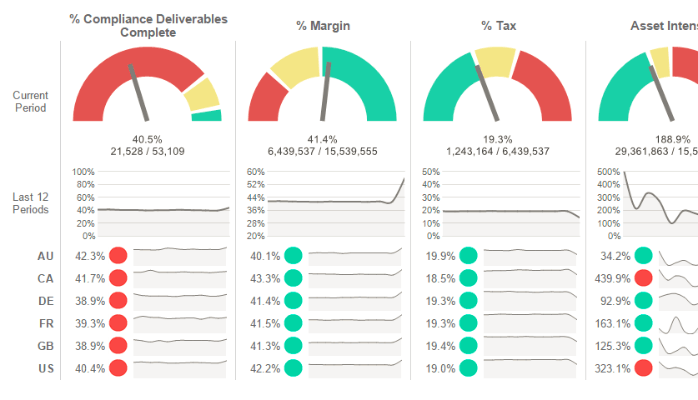
Identifying key metrics for your conversational dashboard sounds easy, but often people can’t limit what they look at to something that will fit on a page. Asking leaders where they want their business to be in a year’s time and how they will measure whether or not they’ve made it is a great start. Once you have 4-5 key areas, make sure they are robust (they make sense when viewed from different perspectives in the organisation, are relevant with big and small teams, aren’t able to be manipulated) and always display them with an indication of their current state (good, ok, bad, etc.)
2. What do I do next? Start by showing metrics over time, as a trend.
People can often have knee-jerk reactions to significant changes, like when there’s a big spike in profit, or higher than expected costs. Timely information is critical but always best viewed in the context over weeks or months. For a bonus, and if the toolset permits, why not adding a forecast for the next 2 to 3 periods.
3. How do I do it? Try breaking key metrics down by one ‘level’ in the organisation.
There can seem to be an unending number of ways to slice up reports. The key to choosing the most helpful way is to understand the natural hierarchy of the organisation. If a leader sees an incorrect number on a report, who are they going to talk with to find out what’s going on? In most cases, a single leader isn’t going to talk to more than a half-dozen different people. If you can identify those people and the areas they look after, you can map the detailed breakdown of information on a report to the conversations business leaders will have with their respective teams, helping put some number to the reality of people’s day-to-day.
Note: the report shown below was built using Microsoft Reporting Services.
About the author:
Chris Ross is a consultant in Data Analytics, and he is passionate about helping organisations and teams make data useful; using it to improve their areas of influence, through the setting of purpose-driven data strategy, implementation of goal-oriented reporting & analytics solutions and the creation of user-focused data tools and processes. He has been working with data and reporting for over ten years, has a degree in Accounting from the Washington State University (USA) and has lived in Sydney since 2010. And if he’s not helping people with data you might find him somewhere enjoying a slow glass of fine whisky.