

OneView for Education
Your school’s data in one place on Microsoft Fabric, with an AI Agent staff can ask.
OneView connects your student information system, LMS, attendance, assessment and wellbeing platforms into one data model in your own Microsoft tenancy. On top of that sit the student profiles and cohort reports leadership teams use every week, and the OneView AI Agent, which answers a plain-English question about the school’s data in about the time it takes to type it.
Antares works with these Australian education institutions




Most schools don’t have a data shortage, they usually have a disconnected systems problem.
Synergetic or TASS has the enrolments and attendance. Canvas or Schoolbox has engagement. NAPLAN and PAT sit in their own portals, and wellbeing notes sit somewhere else again. Each system is good at its job. What none of them can do is show a Head of House one student across all of it, or show the Principal how Year 9 is going without someone building a spreadsheet first.
So when the Principal asks why Year 9 attendance has slipped and wants an answer for Thursday’s executive meeting, someone spends two or three days pulling exports from four systems into Excel. By the time the answer arrives the question has usually moved on. Every school we’ve walked into has a version of this spreadsheet, and usually one person who knows how it works.
- Parent interviewsA Head of House opens three systems to prepare for one twenty-minute conversation.
- Two attendance figuresThe academic report says one thing and the SIS says another. After a while nobody quotes either number in a meeting.
- The Board packDays of a Deputy Principal’s time each term, most of it copying and reconciling rather than thinking.
- Questions with a lagA cohort question asked on Monday gets a report the following week, if someone has the time.
- The AI conversationThe Board wants an AI roadmap. The honest answer is that the data isn’t connected well enough yet for one to mean much.
OneView connects your data so you never need to build a manual report again.
The questions change every term. The data model shouldn’t have to. OneView puts the systems you already run into one education data model on Microsoft Fabric, gives you the student and cohort reports on day one, and adds an AI Agent for everything that comes up in between.
Connect the systems you already run.
Ready-made connectors for Synergetic, TASS, Canvas, Schoolbox, NAPLAN and PAT, plus the wellbeing platforms most Australian schools use. Attendance is defined once, in one place, so the number on a student’s profile is the number in the Board pack. Your systems stay exactly where they are.
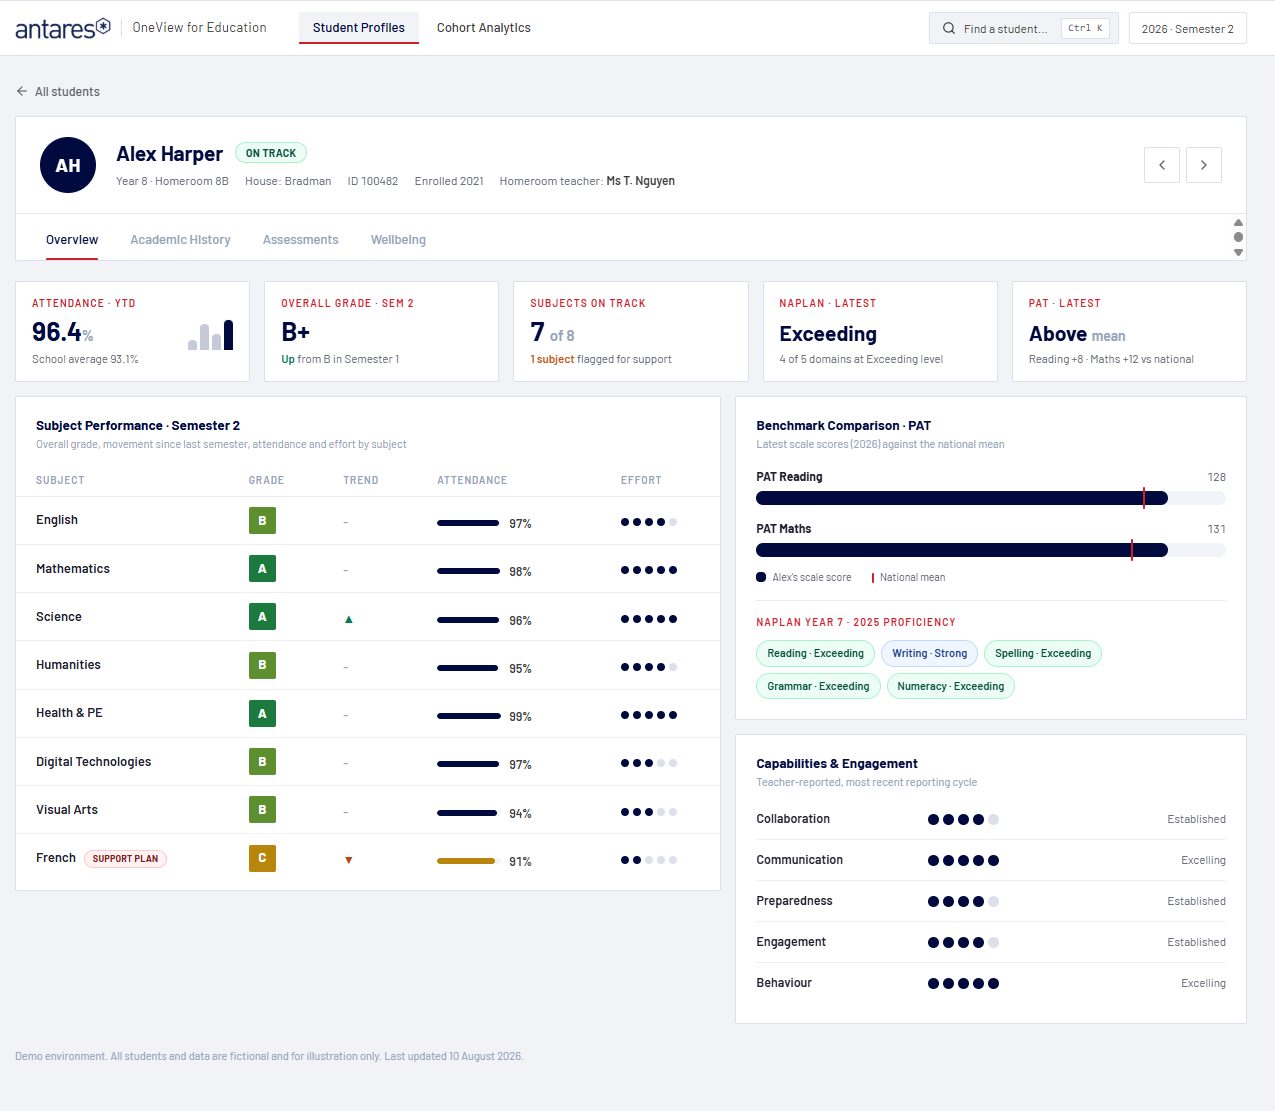
Every student on one page.
Attendance, results and trend, NAPLAN and PAT against the national mean, teacher-reported capabilities, and the wellbeing check-ins and notes the person looking is allowed to see. It holds together across semesters, even where the timetable or grading structure changed halfway through.
How the cohort is going.
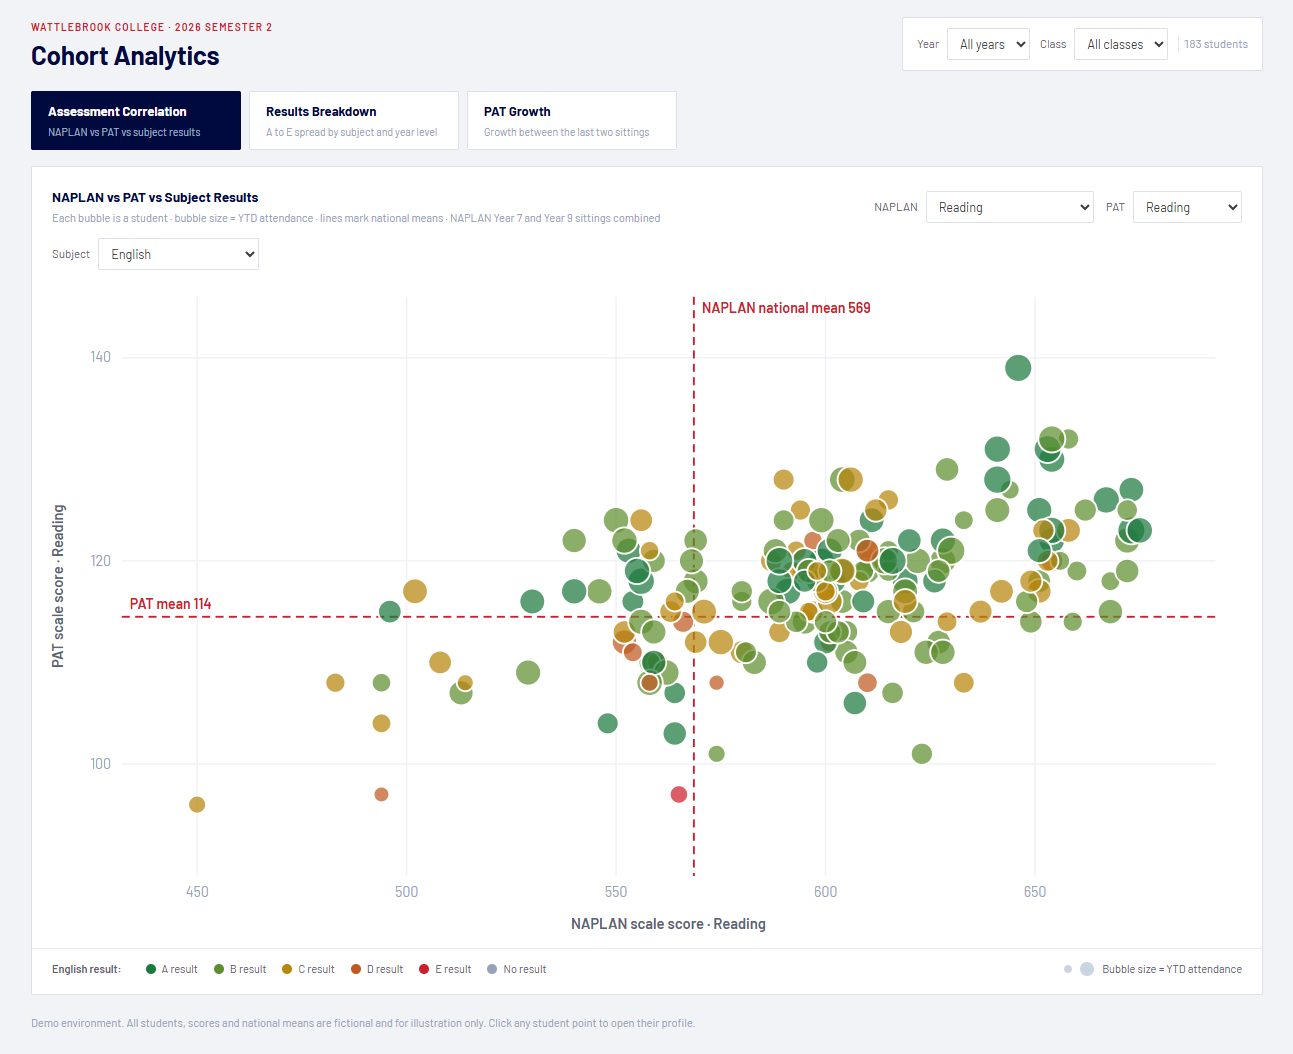
A to E spread by subject and year level. NAPLAN and PAT plotted against classroom marks, which is where the surprises usually are. Growth between sittings. Filter by year, house or class, and click through from any dot on the chart to that student’s profile.
The question nobody built a report for.
Staff type it into the OneView AI Agent the way they’d ask a colleague. The answer comes from the same data model as the reports, under the same permissions, so it agrees with the Board pack rather than arguing with it. See it below
The reports are already built.
A profile for every student and a set of cohort reports for the leadership team, running on the one Microsoft Fabric model. These are the reports most schools end up asking for anyway, so they come with the platform rather than as a second project.
- Student profile: overview, academic history, assessments and wellbeing, one page per student
- Assessment correlation: NAPLAN and PAT results against subject results, for every student in a cohort
- Results breakdown: A to E distribution by subject and by year level
- PAT growth: movement between assessment sittings, by student and by cohort
Filter by year level, house or class. Use them as they are, or we adjust them to the way your school already reports.
See them in a demo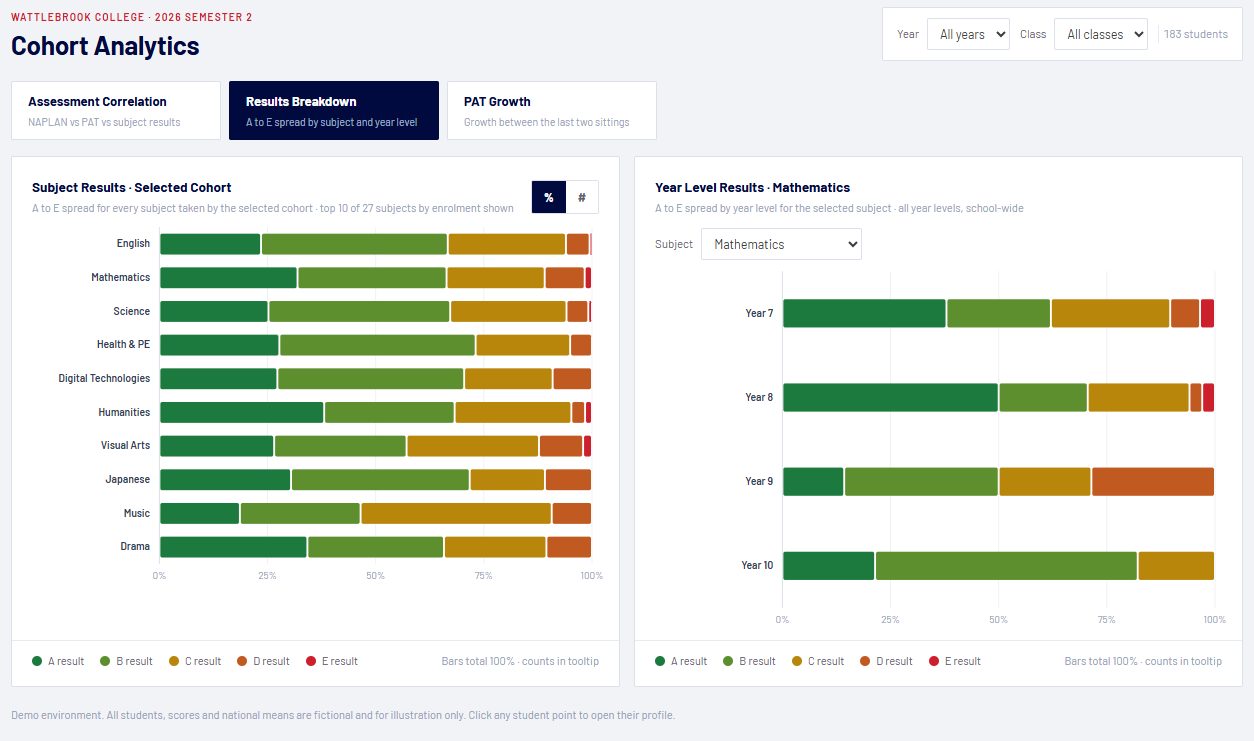
Staff can ask the school’s data a question.
Reports cover the questions you planned for. The OneView AI Agent covers the ones that come up on a Tuesday afternoon. Staff ask in plain English and get an answer from the same Fabric model the reports use, inside the school’s own Microsoft environment.
There’s no prompting to learn. The agent has specialists for attendance, academic performance and writing up student summaries or meeting notes, and Q Platform’s Auto-Select picks the right one from the question. Most staff are using it within a session.
Every question, answer and source is logged. A Head of House sees their students. A Business Manager sees finance and staffing. Nothing leaves the school’s tenancy. The agent runs on Q Platform for Education, which Haileybury has rolled out to more than 150 staff, and there’s no separate AI product or licence to buy.
Explore Q Platform for EducationWhich year levels have declining attendance since Term 1?
10:32 AMThree year levels are trending down against Term 1. Year 8 is the one to look at first.
- Year 8: 94.1% to 90.3%, driven by Mondays and Fridays in 8B and 8D
- Year 10: 93.6% to 92.0%, spread evenly across classes
- Year 12: 91.8% to 90.9%, consistent with the same period last year
Source: Synergetic attendance, 1 Feb to 5 Sep 2026. Would you like this broken down by House or day of week?
10:32 AMDraft a two-paragraph summary of 8B for my meeting with the Head of Wellbeing tomorrow.
10:41 AMHere is a two-paragraph summary of 8B in your school’s meeting-note format, drawing on attendance, PAT results and recorded wellbeing check-ins for the class.
- Attendance trend since Term 1, with the Monday and Friday pattern called out
- PAT Reading and Maths against the national mean
- Open check-ins and support plans, visible only to staff with the right role
Would you like a version for the parents of the students on support plans?
Open summary: 8B Wellbeing Meeting Notes.docx 10:42 AMYour data stays in your Microsoft tenancy, under your roles.
Two questions come up in every conversation with a Business Manager or an IT lead. Where does the data live, and who can see what. Here is the answer to both.
Built on Microsoft Fabric, within your school’s environment.
The data model, the pipelines and the reports all run on Microsoft Fabric in your school’s tenancy, in Microsoft’s Australian data centres. The school owns the platform and the data. Antares runs it. If you’re already on Microsoft 365, most of the foundation is in place.
Access controls built for a school.
Access comes from Microsoft Entra ID, so it follows the roles the school already maintains. A classroom teacher sees their classes. Wellbeing entries are visible only to the staff who should see them. The AI Agent works under exactly the same rules, and every question and answer is audited.
Four steps to OneView in your school.
Demo
Twenty minutes on demo data. Bring the question your current reporting can’t answer and we’ll see whether OneView can.
Book a demoData assessment
We look at your source systems, how clean the data is and what your leadership team actually needs to know. You get a written roadmap and a fixed price before anything is built.
Ask about oneImplementation
Fabric is set up in your tenancy, the systems are connected and the reports go live. Weeks, not a school year.
See the reportsOngoing service
Antares runs it. If your SIS changes its export format over the holidays, that’s our problem. New reports and new sources are added as you need them, without it becoming a new project.
Who runs itConnect the data before you add the AI.
Schools are being offered AI from every direction at the moment. Ask an AI “which students are falling behind?” on disconnected data and it will give you a confident answer to the wrong question. We’ve seen that go badly. OneView does the integration first, so the reports and the AI Agent are both working from figures the school has already agreed are right. Get that order wrong and the rest doesn’t matter.
Who you’d be working with.
Antares has worked with Australian schools, universities and TAFEs for more than 18 years, and has had AI in production in education since 2017. That includes Fabric and Power BI reporting, institution-wide AI agents on Q Platform at Haileybury, Newington, UNSW and CQUniversity, and a lot of LMS and SIS integration work that nobody puts on a website but everything depends on.
We hold Microsoft Specialisations in Analytics on Azure and Microsoft Fabric, Azure AI, Microsoft Copilot, and Adoption and Change Management. The last one matters more than it sounds. A platform that staff don’t use isn’t a platform, so training is part of the service rather than an extra.
- Connectors that exist alreadySynergetic, TASS, Canvas, Schoolbox, NAPLAN, PAT and A to E results. Configured for your school, not written from scratch.
- A team in Sydney and MelbournePeople who have sat in the meeting where the Board pack gets pulled apart.
- One roadmapReports now, the AI Agent alongside them, early-warning indicators next. Same model throughout.
- Still here after go-livePipelines monitored, connectors kept current, staff trained, reports extended.
See it live with Microsoft on 25 September. 45 minutes, mostly demo.
Friday 25 September 2026, 11:00am AEDT, on Microsoft Teams. Register and we’ll send you the recording if the day gets away from you.
Book a demo.
Twenty minutes online, on demo data or on a sample of your own. Fill in the form and someone from the education team will be in touch to find a time.
- No preparation required
- Bring the question your current reporting can’t answer
- We won’t chase you afterwards
FAQs about OneView for Education
Synergetic, TASS, Canvas and Schoolbox out of the box, plus NAPLAN, PAT, A to E results and the wellbeing platforms most Australian schools use. Anything else gets scoped in the data assessment. So far we haven’t met a system we couldn’t connect.
No. It reads from them. Nothing is removed or migrated. If an SIS change is on your horizon, OneView is one of the few things that keeps reporting stable through it.
In your own Microsoft tenancy, in Microsoft’s Australian data centres. Access follows your existing Microsoft Entra ID roles, and wellbeing entries are only visible to staff who hold the right one.
A way for staff to ask a question of the school’s data in plain English and get an answer from the same Fabric model the reports use. It runs on Antares’ Q Platform for Education. Auto-Select picks the right specialist for the question, and every question and answer is logged.
Copilot helps a person with their own documents, email and meetings. The OneView AI Agent answers questions about the school’s operational data, under the school’s roles. They do different jobs, and most schools end up with both.
The demo is twenty minutes. After the data assessment, the integration and the first reports are typically live within weeks. The variable is usually how quickly we can get access to the source systems, not the build.
It’s a managed service. We monitor the pipelines, keep the connectors current when your systems change, train new staff, and work through the next reports on the roadmap with you.
Yes. New reports go on the existing model, and new sources like finance or HR are added as connectors. Adding a report is a conversation, not a project.